


Closing the Yield Gap: Making Sense of Nitrogen Availability and Uptake

Agronomists and ag scientists around the world have known for more than 50 years that yield and protein in cereal grains are closely related. Applying more nitrogen to wheat or barley crops will produce a positive response in yield when the protein content is less than 11.5%.
So what does this mean?
Both yield and protein vary considerably across fields. For wheat, yield can vary from 0.5 to 12+ T/ha and protein can vary from 6% to 18%. However when the final grains contain less than 11.5% (approximately) then the full yield potential was not achieved. If more nitrogen fertilizer had been applied into the field zones where the protein is less than 11.5%, then the yield would have been higher.

Comparison of grain yield and grain protein concentration of commercial wheat varieties.
The graph(1) shows the response of yield and protein to adding nitrogen fertilizer onto strip trials of 10 varieties of wheat at Trangie, NSW, in 2012. The plot shows that at approximately 90kg/ha additional nitrogen the yield reaches a maximum. Adding more nitrogen increases the protein content but does not increase the yield. When the Full Yield Potential is achieved and the protein content is optimized for the use of the grain, then this is the “Sweet Spot” in how much fertilizer should be added.
MORE BY PHILLIP CLANCY


The implication of the Protein Nitrogen/Yield Balance is that farmers have the potential to increase yield and thereby increase their productivity and profitability by applying nitrogen fertilizer into those zones in the field where the protein is low. Until now farmers have been able to measure yield but not protein. The CropScan 3300H On Combine NIR Grain Analyser provides the protein layer necessary to understand the availability and uptake of nitrogen across the field.
What is economic opportunity of increasing yield in cereal crops around the world?
In Australia, the average yield in cereal crops is 1.7T/ha while the Yield Potential is 3.4T/ha.(2) Therefore the Yield Gap is 1.7T/ha. Australia produces around 25 million tonne of wheat and 6 million tonne of barley per year depending on droughts. Reducing the Yield Gap to zero over a period of time would double production and revenues for farmers. Table 1 show the potential economic impact of reducing the Yield Gap to zero over a period of time.
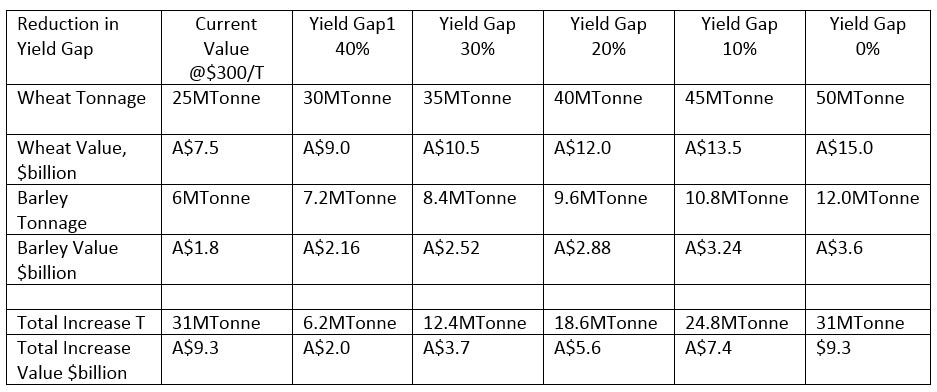
Table 1
The world production of cereal grains is approximately 880,000,000 tonne(4). Not all countries have such low average yield as Australia. Across the world, the yield for wheat crops varies from approximately 2T/ha to 8.7T/ha(2) where as the Yield Potential should be approximately 4T/ha. If 30% of the world’s grain production has a yield of 2T/ha, then the Yield Gap (i.e., the difference between the Yield Potential and the Actual Yield) would be 264,000,000 tonne. This is the potential increase in the tonnage of grain that could be realized by the correct of application of nitrogen fertilizer.
At a value of A$300/tonne, the potential increase in crop value is A$79.2 billion. Another way of looking at this figure; this is the loss in crop value experienced by farmers around the world each year.
How can the Protein/Nitrogen/Yield Balance be used to close the Yield Gap?
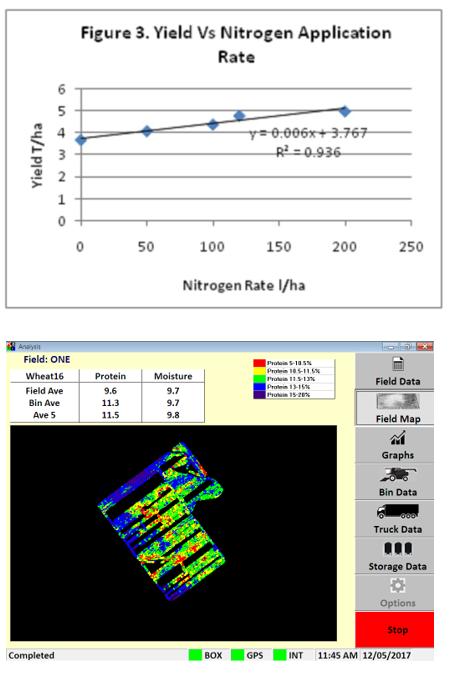
A recent trial by a farmer in Esperance, Western Australia, showed that 100 liters of Flexi-N Liquid Fertilizer(3) increased yield in wheat by 0.6 tonne. He also showed that the protein also increased by 0.9% per 100L of Flexi-N added.
The farmer has been using the CropScan 3000H On Combine Grain Analyser, Next Instruments, Sydney, NSW, to measure protein in wheat on his five New Holland CR Series combines since 2016. The CropScan measures the grain using Near Infrared Transmission technology on a sample of grain taken off the clean grain elevator every 6-10 seconds as the grains are harvested. The protein and moisture data is displayed inside the cabin in the form of real-time field maps and tables.
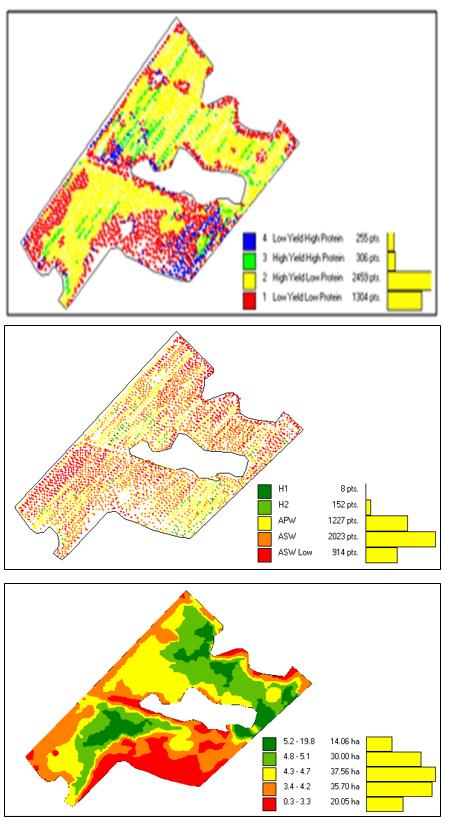
By combining the protein and yield collected off the combine, a Protein Yield Correlation Quadrant map can be generated. This map shows four Performance Zones across the field:
- Blue: Low Yield + High Protein
- Green: High Yield + High Protein
- Yellow: High Yield + Low Protein
- Red: Low Yield + Low Protein
The Protein/Nitrogen/Yield Balance curve shows that a Positive Yield Response can be achieved by applying more nitrogen fertilizer in the zones where the protein is low (i.e., the Red and Yellow zones). The Protein/Yield Correlation Quadrant map shows that approximately 87% of Hill’s field was under fertilized. The Protein map shows that the protein content in these zones ranged from 8.5% to 10.5%. The farmer’s strip trials showed that he should apply between 100 and 330 liters of Flexi-N to increase the protein and thereby increase the yield across the field.
Based on these maps the lost yield across this field in the 2016 harvest was:
- Field size: 137.5 ha
- Red Zone: 41.5 ha
- Yellow Zone: 78.2 ha
- Yield Increase in Red Zone: 74.7 T
- Yield Increase in Yellow Zone: 70.4 T
- Total Lost Yield: 145.1 T
- Lost Income @ A$300/T: A$43,530
Summary
Nitrogen availability and uptake is the missing layer of information that can provide farmers with a simple means of increasing yield (Quantity) and protein (Quality) through Variable Rate Nitrogen Fertilization Applications. Measuring nitrogen in soil and then in the crop during biomass production do not provide a reliable means of determining how much and where the nitrogen has been used by the plant. The only direct measurement of nitrogen availability and uptake is when protein and yield are measured in the grains during harvest. By combining protein, yield, and GPS coordinates off a combine harvester a new analytical tool, the Protein/Yield Correlation Quadrant Map, can be generated. These maps provide a simple means of determining where and how much additional Nitrogen fertilizer will produce a Positive Yield Response.
ABARES data(6) shows that in Australia, the average protein content of wheat is 9.5% and the average yield is 1.7T/ha. If all Australian wheat fields could be mapped with the Protein/Yield Correlation Quadrant Maps, then it could be possible to increase the average yield to 3.4T/ha which would increase the Australian wheat crop by approximately 25 million tonne with an increase in crop payments of $9.3 billion. If the same technology was applied across the world for wheat crops only, then the potential increase in wheat production could be 228,000,000tonne at a value of A$68.4.billion.
1) Comparison of grain yield and grain protein concentration of commercial wheat varieties, R Brill¹, M Gardner², N Fettell³ and G McMullen²
¹NSW DPI Coonamble, ²NSW DPI Tamworth, ³University of New England and NSW DPI, Condobolin, 2012.
2) Bridging the Yield Gap, Author: Zvi Hochman, David Gobbett, Heidi Horan, Di Prestwidge and Javier Navarro Garcia, CSIRO Ecosystem Sciences, 05 Mar 2014.
3) How much Yield will you leave in the Field this harvest, Phillip Clancy, Milling and Grain Magazine, Perrindale Press, Feb 2020.
4) World Agriculture Production, USDA, Foreign Agricultural Service Circular Series WAP 4-20 April 2020
5) US Wheat Associates, 2019 Wheat Quality Report, Arlington, VA, USA
6) Australian Department of Agriculture, Water and Environment, ABARES.
Subscribe Today For